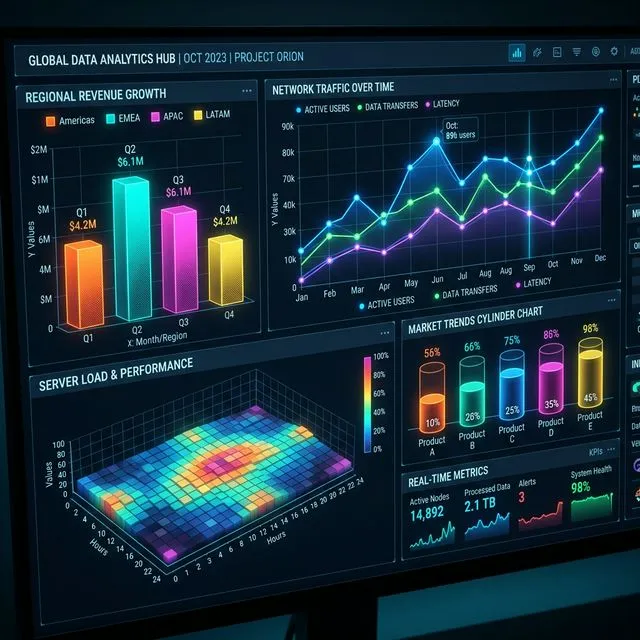
Turn fragmented business data into trusted information your teams can actually use. Mobiloitte Singapore designs data platforms, analytics pipelines, business intelligence dashboards and reporting systems that connect information from existing applications and turn it into consistent, decision-ready metrics.
Every Dashboard Development Singapore & Governed Data Platforms project starts with discovery. We map your workflow goals, constraints, and current systems, then handle the full build cycle including testing and secure deployment.
We work with enterprises, government-linked groups, and fast-growing tech teams that need dependable handover and maintainable code. We also integrate with your existing vendors, legacy systems, and internal IT team.
You work directly with a dedicated delivery lead. When needed, we draw on engineering talent across the wider Mobiloitte network for faster delivery and regional scale.
Challenge
When business information is spread across CRM, ERP, spreadsheets, databases, and operational applications, teams end up debating numbers instead of using them. Common problems include conflicting KPI definitions, duplicate records, manual spreadsheet consolidation, broken data pipelines, and dashboards containing too many cluttering charts. Mobiloitte Singapore resolves these challenges by engineering governed data platforms, reliable ETL/ELT pipelines, and decision-focused dashboards.
Outcomes
Get Started
Speak with our Singapore team to map your requirements, architecture, and implementation timeline.

Full-stack data engineering, analytics pipelines, metrics layers, and custom BI dashboard development.
Data Source Integration
Connect APIs, databases, CRM, ERP, cloud storage, and operational tools into a single architecture.
Data Pipelines & ETL/ELT
Build automated, resilient pipelines for data ingestion, transformation, validation, and error recovery.
Data Warehouse & Analytical Storage
Design cloud data warehouses (Snowflake, BigQuery, Redshift) and lakehouses tailored to your workload.
Data Modelling & Architecture
Engineer star/snowflake schemas, facts, dimensions, master data entities, and clean data relationships.
Governed KPI & Metrics Layer
Establish single, authoritative definitions, calculation formulas, and refresh cycles for every KPI.
Interactive BI Dashboard Development
Design intuitive dashboards with KPI cards, charts, filters, drill-downs, and automated alerts.
Enterprise & Scheduled Reporting
Automate recurring executive report packs, operational summaries, PDF exports, and email delivery.
Embedded Analytics for Applications
Integrate interactive reporting views directly into customer portals, internal tools, or SaaS products.

An 8-step methodology from decision discovery to production data observability.
Decision Discovery
Identify key business questions, required decisions, target audiences, KPIs, and reporting frequencies.
Data Source Assessment
Review applications, databases, APIs, existing reports, source owners, and data quality constraints.
KPI & Data Definition
Define calculation formulas, source ownership, refresh expectations, and dimensional attributes.
Architecture Design
Design ingestion pipelines, data warehouse storage, data models, semantic layers, and security access.
Build & Engineer
Implement ETL/ELT pipelines, data models, dashboards, and automated testing routines.
Validate & Reconcile
Test data accuracy against source systems, verify metric calculations, and audit user permissions.
Roll Out
Deploy dashboards and reports to business users with clear documentation and training.
Monitor & Improve
Track data freshness, pipeline health, query performance, and user adoption metrics.
A data platform is the technical foundation used to collect, transform, organise, govern, and serve information for enterprise analytics, while a BI dashboard provides interactive visual insight.
A data platform connects disparate systems (CRM, ERP, databases, cloud applications) and transforms raw operational data into structured, consistent data models. A Business Intelligence (BI) dashboard sits on top of this governed foundation, translating data into interactive charts, KPI cards, and drill-down reports designed to support specific business decisions.
For insights into how governed data platforms support regional operational engineering, explore our Singapore Delivery Approach and learn about our engineering standards at Why Mobiloitte Singapore.
Selecting the right reporting format based on user needs, interactivity, and decision frequency.
| Feature | Interactive BI Dashboard | Structured Enterprise Report |
|---|---|---|
| Primary Purpose | Designed for continuous monitoring, trends, and interactive exploration | Designed for structured presentation of historical or detailed records |
| Interactivity | Highly interactive with filters, drill-down, and metric segmentation | Often static or formatted for print/PDF with fixed structures |
| Data Focus | Highlights high-level KPIs, target thresholds, and visual alerts | Contains detailed line-item records, transactional lists, or audit logs |
| Refresh Cadence | Updated continuously, near-real-time, or on high-frequency schedules | Generated periodically on weekly, monthly, or quarterly schedules |
| Target Audience | Executives, operational managers, and analytical decision-makers | Regulators, auditors, department leads, and external stakeholders |
Engineering production analytics requires a robust architecture connecting data sources, pipelines, storage, modelling, metrics, and dashboards.
Connecting APIs, databases, CRM/ERP systems, cloud storage, files, and third-party services.
Automated ETL/ELT pipelines handling ingestion, validation, retries, and error routing.
Cloud data warehouses (Snowflake, BigQuery, Redshift), data lakes, or analytical databases.
Designing dimensional models (star/snowflake schemas), facts, dimensions, and master data entities.
Governed semantic layer establishing single, authoritative definitions for every metric.
Interactive dashboards, executive views, operational monitors, and self-service analytics.
SSO, role-based access, row-level security, data masking, and Singapore PDPA alignment.
Data quality checks, pipeline failure alerts, freshness telemetry, and query performance tuning.
Eliminate manual spreadsheet work, establish single-source metrics, and empower teams with decision-ready insights.
Establish consistent, governed KPI definitions so teams stop debating conflicting numbers.
Design dashboards around specific business actions and outcomes rather than cluttered charts.
Automate manual data extraction and consolidation routines across CRM, ERP, and databases.
Empower business teams to explore certified datasets with safety guardrails and access controls.
Detect pipeline delays, missing data, and schema changes before they impact executive meetings.
Create a structured, high-quality data foundation that can feed downstream AI and workflow models.
Designing reporting views around specific departmental roles, workflows, and operational decisions.
High-level visibility for leadership tracking revenue, gross margins, growth metrics, operational risks, and strategic KPIs.
Tracking revenue, operational expenses, profit margins, collections, budget vs actuals, cash flow, and invoice statuses.
Connecting CRM sales stages, pipeline volume, conversion rates, sales cycle length, and rep target performance.
Tracking daily throughput, service queue backlogs, SLA compliance, capacity bottlenecks, and operational exceptions.
Monitoring order fulfilment status, inventory turn, warehouse allocation, supplier reliability, and delivery performance.
Tracking case volumes, average first-response times, resolution times, CSAT scores, and support escalations.
Implementing technical access controls, row-level security, data lineage, and compliance safeguards.
Define explicit calculation formulas, source systems, and business owners for every KPI.
Restrict data access by department, region, management level, or individual user role.
Map data paths from source system ingestion down to individual dashboard visualizations.
Automate validation rules catching duplicates, null values, schema drift, and pipeline latency.
Provide business analysts with certified datasets while restricting unapproved production edits.
Apply data masking, encryption, access controls, and retention rules compliant with Singapore PDPA.
Where reporting platforms handle personal, customer, or employee data, data minimisation, consent management, access logging, and encryption standards are evaluated against Singapore Personal Data Protection Act (PDPA) obligations. Mobiloitte implements technical safeguards while legal accountability remains with your organisation.
Singapore delivery ownership, platform-agnostic architecture, and decision-first reporting design.
Work with Singapore-based account leadership ensuring clear communication, local compliance alignment, and transparent SLAs.
Explore Singapore Delivery →We engineer solutions on your preferred BI stack (Power BI, Tableau, Qlik, Superset) and cloud warehouse (Snowflake, BigQuery, Redshift).
Why Mobiloitte Singapore →Review real enterprise case studies across data engineering, BI dashboards, CRM/ERP integration, and cloud platforms in APAC.
View Client Case Studies →Straight answers on delivery, governance and day-to-day operations.
What is dashboard development?
Dashboard development is the process of defining metrics, connecting relevant data and designing interactive reporting views that help specific users monitor and analyse business performance.
What is the difference between a dashboard and a report?
A dashboard is generally designed for monitoring and interactive exploration, while a report often presents structured or detailed information in a defined format. Organisations frequently use both.
What is a data platform?
A data platform collects, transforms, organises and serves information for reporting, analytics and other approved uses.
Do we need a data warehouse before building dashboards?
Not always. The correct architecture depends on the number of sources, data volumes, analytical complexity, performance and governance requirements.
Can you work with our existing BI platform?
Yes. Where existing technology remains suitable, the architecture can be designed around it rather than forcing an unnecessary replacement.
Can you connect dashboards to CRM and ERP systems?
Where appropriate interfaces are available, CRM, ERP and other applications can act as approved data sources for reporting.
Do dashboards need real-time data?
No. Freshness should follow the business requirement. Scheduled updates are suitable for many reporting workloads, while some operational use cases may justify more frequent processing.
How do you prevent different dashboards showing different KPIs?
Important metrics, source ownership and calculation rules are defined before implementation and reused through governed models or metrics where appropriate.
Can users build their own reports?
Yes, where the selected BI platform supports it. We recommend governed self-service using approved datasets and defined metric boundaries rather than unrestricted copies.
Can dashboards be embedded into our software?
Where supported by the selected reporting technology and security architecture, analytical views can be embedded into internal or customer-facing applications.
Can reports be sent automatically?
Where supported by the reporting platform, scheduled or event-based distribution can be configured according to access and information-security requirements.
Why do dashboards fail?
Dashboards commonly fail due to unvalidated data, conflicting KPI definitions across teams, poor query performance, lack of metric ownership and designing for visual appearance instead of actual decisions.
Which data platform or tool should we use?
Tool selection depends on your current software estate, data sources, user types, security rules and budget. We build solutions using tools like Qlik, Power BI, Tableau, Looker and custom web reporting frameworks.
Can Mobiloitte build custom dashboards inside our web software?
Yes. We build embedded analytics and custom reporting interfaces within customer portals, internal software and SaaS platforms using modern web frameworks and API layers.
How do you handle conflicting KPI definitions across departments?
We help establish a shared metrics/semantic layer so key measures—such as active customer, gross margin or lead conversion—use agreed business logic across all reports.
What data sources can you connect to a dashboard?
We connect CRM platforms, ERP systems, SQL/NoSQL databases, cloud data warehouses, third-party APIs, operational logs and flat files through governed ETL/ELT pipelines.
How do you ensure data quality and accuracy?
Quality controls can validate completeness, formats, duplicates, schema, business rules, freshness and reconciliation.
Can you migrate our existing dashboards?
Yes. Migration normally begins by identifying which existing reports are still useful, which metrics are duplicated and which underlying data definitions need correction before rebuilding them.
How do you measure whether a dashboard project is successful?
Useful measures include data freshness, quality exceptions, reconciliation, report adoption, dashboard performance and reduction in recurring manual reporting effort.
Can the same data platform support future AI projects?
Potentially. A governed data platform can provide a stronger foundation for AI, but access, data quality and use-case-specific architecture still need to be assessed separately.
Start with the decisions your teams need to make. Then define the KPIs, identify the authoritative data, and build the pipelines, models, and dashboards needed to support those decisions. Mobiloitte Singapore can help design the data architecture, implement the reporting layer, and establish operational controls.